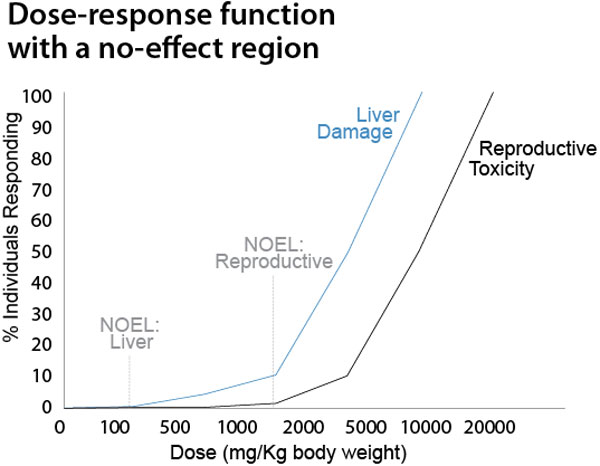
One note to add while discussing concepts, is the term known as the threshold dose. This is the dose or exposure level, below which he adverse effects of a substance are not expressed by the exposed population. When we refer to exposure, we are referring to the actual amount of the substance that will be absorbed into the body when exposed and not just the amount of the substance that is in the surrounding environment. Dose in some ways also takes into account the mass of the individual being exposed. Although it may seem that I am discussing dose-response in a negative light there are also many positives that come from studying this concept. Response to a substance may lead to the curing of a disease or simply relieving pain but in order for these to take place, the exposure levels must fall within the range of certain upper and lower bounds regarding the dosage. An example of a dose response curve is provided below.

The problem with illustrating the threshold dose is that a dose-response curve is not always a linear relationship. In fact, in most cases the relationship is a complex logarithmic or hyperbolic curve. One example of a Dose-Response Curve can be found here. On the other hand, the nice thing about dose-response curves is that they can contrast two or more different substances with varying toxicities. From here comparisons of the graphs can be useful when evaluating toxicity. In general, the greater the slope of the graph, the more toxic the material is. For a little further explanation on how the graph is plotted and what it contains you can click here.
